Median in medical statistics. Average or still median? "Statistical research: collection and grouping of statistical data"
To calculate the median in MS EXCEL, there is a special function MEDIAN(). In this article we will define the median and learn how to calculate it for a sample and for a given distribution law random variable.
Let's start with medians For samples(i.e. for a fixed set of values).
Sample median
Median(median) is a number that is the middle of a set of numbers: half of the numbers in the set are greater than median, and half the numbers are less than median.
To calculate medians necessary first (values in sample). For example, median for sample (2; 3; 3; 4 ; 5; 7; 10) will be 4. Because just in sample 7 values, three of them are less than 4 (i.e. 2; 3; 3), and three values are greater (i.e. 5; 7; 10).
If the set contains an even number of numbers, then it is calculated for the two numbers in the middle of the set. For example, median for sample (2; 3; 3 ; 6 ; 7; 10) will be 4.5, because (3+6)/2=4.5.
For determining medians in MS EXCEL there is a function of the same name MEDIAN(), English version MEDIAN().
Median does not necessarily coincide with . A match occurs only if the values in the sample are distributed symmetrically with respect to average. For example, for samples (1; 2; 3 ; 4 ; 5; 6) median And average equal to 3.5.
If known Distribution function F(x) or probability density function p(X), That median can be found from the equation:

For example, having decided analytically this is the equation for the Lognormal distribution lnN(μ; σ 2), we obtain that median calculated using the formula =EXP(μ). When μ=0, the median is 1.

Pay attention to the point Distribution functions, for which F(x)=0.5(see picture above) . The abscissa of this point is equal to 1. This is the value of the median, which naturally coincides with the previously calculated value using the em formula.
In MS EXCEL median For lognormal distribution LnN(0;1) can be calculated using the formula =LOGNORM.REV(0.5,0,1).
Note: Recall that the integral of over the entire domain of specifying the random variable is equal to one.

Therefore, the median line (x=Median) divides the area under the graph probability density function into two equal parts.
Salaries in various sectors of the economy, temperature and precipitation levels in the same territory for comparable periods of time, the yield of crops grown in different geographical regions, etc. However, the average is by no means the only generalizing indicator - in some cases for a more accurate assessment a suitable value is the median. In statistics, it is widely used as an auxiliary descriptive characteristic of the distribution of a characteristic in a particular population. Let's figure out how it differs from the average one, and also why it is necessary to use it.
Median in statistics: definition and properties
Imagine the following situation: 10 people work in a company together with the director. Ordinary workers receive 1,000 UAH, and their manager, who is also the owner, receives 10,000 UAH. If we calculate the arithmetic average, it turns out that on average the salary is this enterprise equal to 1900 UAH. Will this statement be true? Or let's take this example: in the same hospital ward there are nine people with a temperature of 36.6 °C, and one person whose temperature is 41 °C. The arithmetic mean in this case is equal to: (36.6*9+41)/10 = 37.04 °C. But this does not mean that everyone present is sick. All this suggests that the average alone is often not enough, and that is why the median is used in addition to it. In statistics, this indicator is called the option that is located exactly in the middle of the ordered variation series. If we calculate it for our examples, we get 1000 UAH, respectively. and 36.6 °C. In other words, a median in statistics is a value that divides a series in half in such a way that on both sides of it (down or up) there are the same number of units in a given population. Because of this property, this indicator has several other names: 50th percentile or 0.5 quantile.

How to find the median in statistics
The method for calculating this value largely depends on what type of variation series we have: discrete or interval. In the first case, the median is found quite simply in statistics. All you have to do is find the sum of the frequencies, divide it by 2 and then add ½ to the result. It would be best to explain the calculation principle using the following example. Let's say we have grouped data on fertility and want to find out what the median is.
Family group number by number of children | Number of families |
After some simple calculations, we find that the required indicator is: 195/2 + ½ = option. In order to find out what this means, you should sequentially accumulate frequencies, starting with the smallest options. So, the sum of the first two lines gives us 30. It is clear that there are no 98 options here. But if you add the frequency of the third option (70) to the result, you get a sum equal to 100. It contains exactly the 98th option, which means the median will be a family that has two children.

As for the interval series, the following formula is usually used:
M e = X Me + i Me * (∑f/2 - S Me-1)/f Me, in which:
- X Me - the first value of the median interval;
- ∑f - number of series (sum of its frequencies);
- i Ме - the value of the median range;
- f Me - frequency of the median range;
- S Ме-1 is the sum of cumulative frequencies in the ranges preceding the median.
Again, it’s quite difficult to understand without an example. Suppose there is data on the value
Salary, thousand rubles. | Accumulated frequencies |
|
To use the above formula, we first need to determine the median interval. As such a range, choose the one whose accumulated frequency exceeds half of the total sum of frequencies or is equal to it. So, dividing 510 by 2, we find that this criterion corresponds to the interval with a salary value of 250,000 rubles. up to 300,000 rub. Now you can substitute all the data into the formula:
M e = X Me + i Me * (∑f/2 - S Me-1)/f Me = 250 + 50 * (510/2 - 170) / 115 = 286.96 thousand rubles.
We hope our article was useful and you now have a clear understanding of what a median is in statistics and how it should be calculated.
A number that characterizes a sample (for example, a set of numbers). If all the sample elements are different, then the median is the sample number such that exactly half of the sample elements are greater than it, and the other half are less than it. In more general case The median can be found by ordering the elements of the sample in ascending or descending order and taking the middle element. For example, the sample (11, 9, 3, 5, 5) after ordering turns into (3, 5, 5, 9, 11) and its median is the number 5. If the sample has an even number of elements, the median may not be uniquely determined: for numerical data, the half-sum of two adjacent values is most often used (that is, the median of the set (1, 3, 5, 7) is taken equal to 4), for more details see.
The median can also be defined for random variables: in this case, it divides the distribution in half. Roughly speaking, the median of a random variable is a number such that the probability of getting the value of the random variable to the right of it is equal to the probability of getting the value to the left of it (and they are both equal to 1/2); more precise definition cm. .
The median can also be said to be the 50th percentile, 0.5-quantile, or second quartile of a sample or distribution.
Properties of the median for random variables
F (x) = 0.5 (\displaystyle F(x)=0.5)If the distribution is a continuous strictly increasing function, then the solution to the equation is unique. If the distribution has discontinuities, then the median may coincide with the minimum or maximum (extreme) possible value of the random variable, which contradicts the “geometric” understanding of this term.
The median is important characteristic distribution of a random variable and, like the expected value, can be used to center the distribution. Since estimates of the median are more robust, its estimation may be more preferable for distributions with the so-called. heavy tails. However, the advantages of estimating the median compared to the mathematical expectation can only be discussed if these characteristics of the distribution coincide, in particular, for symmetric probability density functions.
The median is determined for all distributions, and in case of ambiguity, naturally is further defined, while the mathematical expectation may not be defined (for example, for the Cauchy distribution).
Usage example
Suppose there were 19 poor people and one millionaire in one room. Every poor person has $5, and every millionaire has $1 million (10 6). The total is $1,000,095. If we divide the money equally among 20 people, we get $50,004.75. This will be the arithmetic average of the amount of money that all 20 people in this room had.
The median in this case will be equal to $5 (half the sum of the tenth and eleventh, median values of the ranked series). This can be interpreted as follows. Having divided our company into two equal groups of 10 people, we can say that in the first group everyone has no more than $5, and in the second no less than $5. In general, we can say that the median is how much the “average” person brought with him. On the contrary, the arithmetic average is an inappropriate characteristic, since it significantly exceeds the amount of cash available to the average person.
Due to the fact that the researcher does not have data on the sales volume at each exchange office, calculating the arithmetic average to determine the average price per dollar is impractical.
Median of a series of numbers
However, it is possible to determine the value of the attribute, which is called the median (Me). Median
in our example ![]()
![]()
Median number: NoMe = ;
Fashion
Table 3.6.
![]()
f— sum of frequencies of the series;
![]()
S cumulative frequencies
![]() 12_
12_
 _
_
S—accumulated frequencies.
In Fig. 3.2. Shown is a histogram of the distribution of banks by profit margin (according to Table 3.6.).
x - profit amount, million rubles,
f is the number of banks.
"MEDIAN OF ORDERED SERIES"
Text HTML version of the publication
Algebra lesson notes in 7th grade
Lesson topic: “MEDIAN OF AN ORDERED SERIES.”
teacher of the Ozyornaya school, branch of the MCOU Burkovskaya secondary school Eremenko Tatyana Alekseevna
Goals:
the concept of median as a statistical characteristic of an ordered series; develop the ability to find the median for ordered series with an even and odd number of terms; to develop the ability to interpret the values of the median depending on the practical situation, to consolidate the concept of the arithmetic mean of a set of numbers. Develop independent work skills. Develop an interest in mathematics.
During the classes
Oral work.
The rows are given: 1) 4; 1; 8; 5; 1; 2) ; 9; 3; 0.5; ; 3) 6; 0.2; ; 4; 6; 7.3; 6. Find: a) the greatest and smallest value each row; b) the scope of each row; c) the mode of each row.
II. Explanation of new material.
Work according to the textbook. 1. Let's consider the problem from paragraph 10 of the textbook. What does ordered series mean? I would like to emphasize that before finding the median, you must always order the data series. 2.On the board we get acquainted with the rules for finding the median for series with an even and odd number of terms:
Median
orderly
row
numbers
With
odd
number
members
is the number written in the middle, and
median
ordered series
numbers
with an even number of members
is called the arithmetic mean of two numbers written in the middle.
Median
arbitrary
row
is called the median 1 3 1 7 5 4 of the corresponding ordered series.
I note that the indicators are the arithmetic mean, mode and median according to
differently
characterize
data,
received
result
observations.
III. Formation of skills and abilities.
1st group. Exercises on applying formulas for finding the median of an ordered and unordered series. 1.
№ 186.
Solution: a) Number of members of the series P= 9; median Meh= 41; b) P= 7, the row is ordered, Meh= 207; V) P= 6, the row is ordered, Meh= = 21; G) P= 8, the row is ordered, Meh= = 2.9. Answer: a) 41; b) 207; at 21; d) 2.9. Students comment on how to find the median. 2. Find the arithmetic mean and median of a series of numbers: a) 27, 29, 23, 31, 21, 34; V) ; 1. b) 56, 58, 64, 66, 62, 74. Solution: To find the median, it is necessary to order each row: a) 21, 23, 27, 29, 31, 34. P = 6; X = = 27,5; Meh= = 28; 20 22 2 + 2, 6 3, 2 2 + 1125 ; ; ; 3636 21 23 27 29 31 34 165 66 +++++ = 27 29 2 + b) 56, 58, 62, 64, 66, 74.
How to find the median in statistics
P = 6; X = 63,3; Meh= = 63; V) ; 1. P = 5; X = : 5 = 3: 5 = 0,6; Meh = . 3.
№ 188
(orally). Answer: yes; b) no; c) no; d) yes. 4. Knowing that an ordered series contains T numbers, where T- Not even number, indicate the number of the term that is the median if T equals: a) 5; b) 17; c) 47; d) 201. Answer: a) 3; b) 9; c) 24; d) 101. 2nd group. Practical tasks on finding the median of the corresponding series and interpreting the result obtained. 1.
№ 189.
Solution: Number of series members P= 12. To find the median, the series must be ordered: 136, 149, 156, 158, 168, 174, 178, 179, 185, 185, 185, 194. Median of the series Meh= = 176. Monthly output was greater than the median for the following members of the artel: 56 58 62 64 66 74 380 66 +++++ =≈ 62 64 2 + 1125 ; ; ; 3636 1125 12456 18 1:5:5 6336 6 6 ++++ ⎛⎞ ++++ = = ⎜⎟ ⎝⎠ 2 3 67 174 178 22 xx+ + = 1) Kvitko; 4) Bobkov; 2) Baranov; 5) Rilov; 3) Antonov; 6) Astafiev. Answer: 176. 2.
№ 192.
Solution: Let's sort the data series: 30, 31, 32, 32, 32, 32, 32, 32, 33, 35, 35, 36, 36, 36, 38, 38, 38, 40, 40, 42; number of series members P= 20. Swing A = x max – x min = 42 – 30 = 12. Fashion Mo= 32 (this value occurs 6 times - more often than others). Median Meh= = 35. In this case, the range shows the greatest variation in the time for processing the part; the mode shows the most typical processing time value; median – processing time, which was not exceeded by half of the turners. Answer: 12; 32; 35.
IV. Lesson summary.
– What is the median of a series of numbers called? – Can the median of a series of numbers not coincide with any of the numbers in the series? – What number is the median of an ordered series containing 2 P numbers? 2 P– 1 numbers? – How to find the median of an unordered series?
Homework:
№ 187, № 190, № 191, № 254. 10 11 35 35 22 xx + + =
To the section basic general education
Mode and median
Average values also include mode and median.
Median and mode are often used as average characteristic in those populations where the calculation of the average (arithmetic, harmonic, etc.) is impossible or impractical.
For example, a sample survey of 12 commercial currency exchange offices in Omsk made it possible to record different prices for the dollar when selling it (data as of October 10, 1995 at the exchange rate of the dollar -4493 rubles).
Due to the fact that the researcher does not have data on the sales volume at each exchange office, calculating the arithmetic average to determine the average price per dollar is impractical. However, it is possible to determine the value of the attribute, which is called the median (Me). Median lies in the middle of the ranked row and divides it in half.
The calculation of the median for ungrouped data is as follows:
a) arrange the individual values of the characteristic in ascending order:
4500 4500 4535 4540 4550 4560 4560 4560 4560 4570 4570 4570
b) determine the ordinal number of the median using the formula:
in our example ![]() this means that the median in this case is located between the sixth and seventh values of the attribute in the ranked series, since the series has an even number of individual values. Thus, Me is equal to the arithmetic mean of the neighboring values: 4550, 4560.
this means that the median in this case is located between the sixth and seventh values of the attribute in the ranked series, since the series has an even number of individual values. Thus, Me is equal to the arithmetic mean of the neighboring values: 4550, 4560.
![]()
c) consider the procedure for calculating the median in the case of an odd number of individual values.
Let's say we observe not 12, but 11 currency exchange points, then the ranked series will look like this (discard the 12th point):
4500 4500 4535 4540 4550 4560 4560 4560 4560 4570 4570
Median number: NoMe = ;
in sixth place is = 4560, which is the median: Me = 4560. On both sides of it there are the same number of points.
Fashion— this is the most common value of a characteristic among units of a given population. It corresponds to a specific attribute value.
In our case, the modal price per dollar can be called 4560 rubles: this value is repeated 4 times, more often than all others.
In practice, the mode and median are usually found using grouped data. As a result of the grouping, a series of distributions of banks was obtained according to the amount of profit received for the year (Table 3.6.).
Table 3.6.
Grouping of banks by the amount of profit received for the year
To determine the median, you need to calculate the sum of the cumulative frequencies. The total increase continues until the cumulative sum of frequencies exceeds half the sum of frequencies. In our example, the sum of accumulated frequencies (12) exceeds half of all values (20:2). This value corresponds to the median interval, which contains the median (5.5 - 6.4). Let's determine its value using the formula:
![]()
where is the initial value of the interval containing the median;
— the value of the median interval;
f— sum of frequencies of the series;
— the sum of cumulative frequencies preceding the median interval;
— frequency of the median interval.
Thus, 50% of banks have a profit of 6.1 million rubles, and 50% of banks have a profit of more than 6.1 million rubles.
The highest frequency also corresponds to the interval 5.5 - 6.4, i.e. the mode must be in this interval. We determine its value using the formula:
![]()
where is the initial value of the interval containing the mode;
— the value of the modal interval;
— frequency of the modal interval;
— frequency of the interval preceding the modal;
— frequency of the interval following the modal one.
The given mode formula can be used in variation series with equal intervals.
Thus, in this population, the most common profit size is 6.10 million rubles.
The median and mode can be determined graphically. The median is determined by the cumulate (Fig. 3.1.). To construct it, it is necessary to calculate the cumulative frequencies and frequencies. Cumulative frequencies show how many population units have attribute values no greater than the value under consideration, and are determined by sequential summation of interval frequencies. When constructing a cumulative interval distribution series, the lower limit of the first interval corresponds to a frequency equal to zero, and the upper limit corresponds to the entire frequency of a given interval. The upper limit of the second interval corresponds to the cumulative frequency, equal to the sum frequencies of the first two intervals, etc.
Let's construct a cumulative curve according to the data in Table. 6 on the distribution of banks by profit margin.
S cumulative frequencies
![]() 12_
12_
_
3.7-4.6 4.6-5.5 5.5-6.4 6.4-7.3 7.3-8.2 X profit
Rice. 3.1. Cumulates of the distribution series of banks by profit margin:
x - profit amount, million rubles,
S—accumulated frequencies.
To determine the median, the height of the largest ordinate, which corresponds to the total population size, is divided in half. A straight line is drawn through the resulting point, parallel to the abscissa axis, until it intersects with the cumulate. The abscissa of the intersection point is the median.
The mode is determined by the distribution histogram. The histogram is built like this:
Equal segments are plotted on the abscissa axis, which on the accepted scale correspond to the size of the intervals of the variation series. Rectangles are constructed on the segments, the areas of which are proportional to the frequencies (or frequencies) of the interval.
Median in statistics
3.2. Shown is a histogram of the distribution of banks by profit margin (according to Table 3.6.).
3.7-4.6 4.6-5.5 5.5-6.4 6.4-7.3 7.3-8.2 X
Rice. 3.2. Distribution of commercial banks by profit margin:
x - profit amount, million rubles,
f is the number of banks.
To determine the mode, we connect the right vertex of the modal rectangle to the upper right corner of the previous rectangle, and the left vertex of the modal rectangle to the upper left corner of the subsequent rectangle. The abscissa of the intersection point of these lines will be the distribution mode.
Median (statistics)
Median (statistics), in mathematical statistics, a number characterizing a sample (for example, a set of numbers). If all the sample elements are different, then the median is the sample number such that exactly half of the sample elements are greater than it, and the other half are less than it. More generally, the median can be found by ordering the elements of a sample in ascending or descending order and taking the middle element. For example, the sample (11, 9, 3, 5, 5) after ordering turns into (3, 5, 5, 9, 11) and its median is the number 5. If the sample has an even number of elements, the median may not be uniquely determined: for numerical data, the half-sum of two adjacent values is most often used (that is, the median of the set (1, 3, 5, 7) is taken equal to 4).
In other words, a median in statistics is a value that divides a series in half in such a way that on both sides of it (down or up) there are the same number of units in a given population.
Task No. 1. Calculation of arithmetic mean, modal and median values
Because of this property, this indicator has several other names: 50th percentile or 0.5 quantile.
- Average value
- Median
- Fashion
Median (statistics)
Median (statistics), in mathematical statistics, a number characterizing a sample (for example, a set of numbers). If all the sample elements are different, then the median is the sample number such that exactly half of the sample elements are greater than it, and the other half are less than it. More generally, the median can be found by ordering the elements of a sample in ascending or descending order and taking the middle element. For example, the sample (11, 9, 3, 5, 5) after ordering turns into (3, 5, 5, 9, 11) and its median is the number 5.
5.5 Mode and median. Their calculation in discrete and interval variation series
If there is an even number of elements in the sample, the median may not be uniquely determined: for numerical data, the half-sum of two adjacent values is most often used (that is, the median of the set (1, 3, 5, 7) is taken equal to 4).
In other words, a median in statistics is a value that divides a series in half in such a way that on both sides of it (down or up) there are the same number of units in a given population. Because of this property, this indicator has several other names: 50th percentile or 0.5 quantile.
The median is used instead of the arithmetic mean when the extreme options of the ranked series (smallest and largest) in comparison with the rest turn out to be excessively large or excessively small.
The MEDIAN function measures central tendency, which is the center of a set of numbers in a statistical distribution. There are three most common ways to determine central tendency:
- Average value- arithmetic mean, which is calculated by adding a set of numbers and then dividing the resulting sum by their number.
For example, the average of the numbers 2, 3, 3, 5, 7 and 10 is 5, which is the result of dividing their sum of 30 by their sum of 6. - Median- a number that is the middle of a set of numbers: half the numbers have values greater than the median, and half the numbers have values less.
For example, the median for the numbers 2, 3, 3, 5, 7 and 10 would be 4. - Fashion- the number most often found in a given set of numbers.
For example, the mode for the numbers 2, 3, 3, 5, 7 and 10 would be 3.
Algebra lesson in 7th grade.
Topic: “Median as a statistical characteristic.”
Teacher Egorova N.I.
The purpose of the lesson: to form in students an idea of the median of a set of numbers and the ability to calculate it for simple numerical sets, to consolidate the concept of the arithmetic mean of a set of numbers.
Lesson type: explanation of new material.
During the classes
1. Organizational moment.
Inform the topic of the lesson and formulate its goals.
2. Updating previous knowledge.
Questions for students:
What is the arithmetic mean of a set of numbers?
Where is the arithmetic mean located within a set of numbers?
What characterizes the arithmetic mean of a set of numbers?
Where is the arithmetic mean of a set of numbers often used?
Oral tasks:
Find the arithmetic mean of a set of numbers:
Checking homework.
Textbook: No. 169, No. 172.
3. Studying new material.
In the previous lesson, we became acquainted with such a statistical characteristic as the arithmetic mean of a set of numbers. Today we will devote a lesson to one more statistical characteristics– median.
Not only the arithmetic mean shows where on the number line the numbers of any set are located and where their center is. Another indicator is the median.
The median of a set of numbers is the number that divides the set into two equal parts. Instead of “median,” you could say “middle.”
First, let's look at examples of how to find the median, and then give a strict definition.
Consider the following oral example using a projector
At the end school year 11 7th grade students passed the 100 meter running standard. The following results were recorded:
After the guys ran the distance, Petya approached the teacher and asked what his result was.
“Most average result: 16.9 seconds,” the teacher replied.
"Why?" – Petya was surprised. – After all, the arithmetic average of all the results is approximately 18.3 seconds, and I ran more than a second better. And in general, Katya’s result (18.4) is much closer to the average than mine.”
“Your result is average, since five people ran better than you, and five - worse. That is, you are right in the middle,” said the teacher.
Write down an algorithm for finding the median of a set of numbers:
Arrange a number set (make a ranked series).
Simultaneously cross out the “largest” and “smallest” numbers of a given set of numbers until one or two numbers remain.
If there is one number left, then it is the median.
If there are two numbers left, then the median will be the arithmetic mean of the two remaining numbers.
Invite students to independently formulate the definition of the median of a set of numbers, then read the definition of the median in the textbook (p. 40), then solve No. 186 (a, b), No. 187 (a) of the textbook (p. 41).
Comment:
Draw students' attention to an important fact: the median is practically insensitive to significant deviations of individual extreme values of sets of numbers. In statistics, this property is called stability. The stability of a statistical indicator is a very important property; it insures us against random errors and some unreliable data.
4. Consolidation of the studied material.
Problem solving.
Let's denote x-arithmetic mean, Me-median.
Set of numbers: 1,3,5,7,9.
x=(1+3+5+7+9):5=25:5=5,
Set of numbers: 1,3,5,7,14.
x=(1+3+5+7+14):5=30:5=6.
a) Set of numbers: 3,4,11,17,21
b) Set of numbers: 17,18,19,25,28
c) Set of numbers: 25, 25, 27, 28, 29, 40, 50
Conclusion: the median of a set of numbers consisting of an odd number of members is equal to the number in the middle.
a) A set of numbers: 2, 4, 8, 9.
Me = (4+8):2=12:2=6
b) A set of numbers: 1,3,5,7,8,9.
Me = (5+7):2=12:2=6
The median of a set of numbers containing an even number of terms is equal to half the sum of the two numbers in the middle.
The student received the following grades in algebra during the quarter:
5, 4, 2, 5, 5, 4, 4, 5, 5, 5.
Find the mean and median of this set.
Let's find the average score, that is, the arithmetic mean:
x= (5+4+2+5+5+4+4+5+5+5): 10=44:10 = 4.4
Let's find the median of this set of numbers:
Let's order the set of numbers: 2,4,4,4,5,5,5,5,5,5
There are only 10 numbers, to find the median you need to take the two middle numbers and find their half-sum.
Me = (5+5):2 = 5
Question for students: If you were a teacher, what grade would you give this student for the quarter? Justify your answer.
The president of the company receives a salary of 300,000 rubles. three of his deputies receive 150,000 rubles each, forty employees - 50,000 rubles each. and the cleaning lady's salary is 10,000 rubles. Find the arithmetic mean and median of salaries in the company. Which of these characteristics is more beneficial for the president to use for advertising purposes?
x = (300000+3·150000+40·50000+10000):(1+3+40+1) = 2760000:45=61333.33 (rub.)
No. 6. Orally.
A) How many numbers are there in a set if its ninth term is its median?
B) How many numbers are there in a set if its median is the arithmetic mean of the 7th and 8th terms?
B) In a set of seven numbers greatest number increased by 14. Will this change the arithmetic mean and median?
D) Each of the numbers in the set is increased by 3. What happens to the arithmetic mean and median?
Sweets in the store are sold by weight. To find out how many candies are contained in one kilogram, Masha decided to find the weight of one candy. She weighed several candies and got the following results:
12, 13, 14, 12, 15, 16, 14, 13, 11.
Both characteristics are suitable for estimating the weight of one candy, because they are not very different from each other.
So, to characterize statistical information, the arithmetic mean and median are used. In many cases, one of the characteristics may not have any meaningful meaning (for example, having information about the time of road accidents, it hardly makes sense to talk about the arithmetic mean of these data).
Homework: paragraph 10, No. 186 (c, d), No. 190.
5. Lesson summary. Reflection.
"Statistical research: collection and grouping of statistical data"
Lesson
… Topics, proposed for the seventh class. THEMATIC PLANNING. § 1. Statisticalcharacteristics. P 1. Arithmetic mean, range and mode 1h. P 2. MedianHowstatisticalcharacteristic …
Work program of the algebra curriculum in grade 7 (basic level) explanatory note
... clause 10 MedianHowstatisticalcharacteristic 23 p.9 Arithmetic mean, range and mode 24 Test No. 2 by topic …
Working programm. Mathematics. 5th grade p. Kanashi. 2011
Working programm
... equations. Arithmetic mean, range and mode. MedianHowstatisticalcharacteristic. The goal is to systematize and summarize information about ... and skills acquired at lessons according to topics(well algebra 10 class). 11 Class(4 hours a week...
Order No. 51 dated “30” August 2012 Work program for algebra 7th grade
Working programm
… educational material MedianHowstatisticalcharacteristic Know the definition of arithmetic mean, range, mode and mediansHowstatisticalcharacteristics Frontal and individual...
Work program in mathematics grade 7 ii level basic level (1)
Working programm
How to find the median of a series
same, How at 6 class. Studying Topics ends with students familiarizing themselves with the simplest statisticalcharacteristics: average... M.: Publishing house "Genzher", 2009. 3. Zhokhov, V.I. Lessonsalgebra at 7 class: book for the teacher / V. I. Zhokhov ...
Other similar documents...
The MEDIAN function in Excel is used to analyze a range of numeric values and returns a number that is the middle of the set being examined (the median). That is, this function conditionally divides a set of numbers into two subsets, the first of which contains numbers less than the median, and the second - more. The median is one of several methods for determining the central tendency of a range of interest.
Examples of using the MEDIAN function in Excel
When researching age groups students, data from a randomly selected group of students at the university were used. The task is to determine the average age of students.
Initial data:
Formula for calculation:
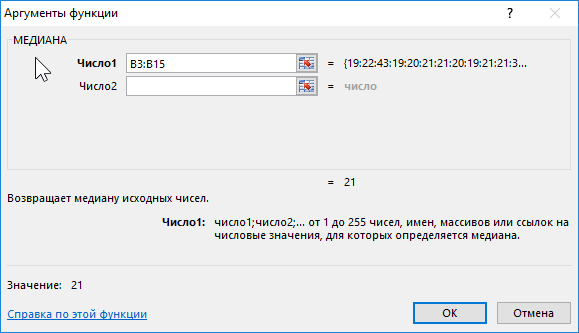
Argument description:
- B3:B15 – range of ages studied.
Result:
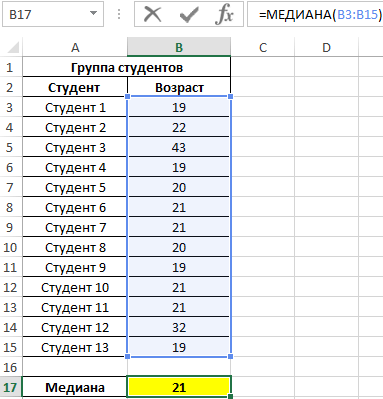
That is, there are students in the group whose age is less than 21 years old and more than this value.
Comparing the MEDIAN and AVERAGE functions for calculating the average value
During the evening rounds in the hospital, each patient's body temperature was measured. Demonstrate the usefulness of using the median parameter instead of the mean value to examine a range of obtained values.
Initial data:
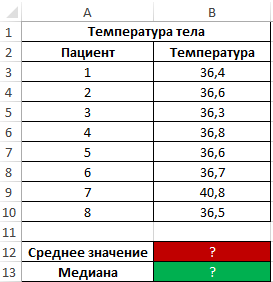
Formula for finding the average:

Formula for finding the median:

As can be seen from the average value, on average the temperature of patients is higher than normal, but this is not true. The median indicates that at least half of the patients have normal temperature body, not exceeding 36.6.
Attention! Another method for determining central tendency is mode (the most frequently occurring value in the range under study). To determine central tendency in Excel, you should use the MODE function. Please note: in in this example the values of the median and mode are the same:

That is, the median value dividing one set into subsets of smaller and large values is also the most frequently occurring value in the set. As you can see, most patients have a temperature of 36.6.
An example of calculating the median in statistical analysis in Excel
Example 3. There are 3 salespeople working in a store. Based on the results of the last 10 days, it is necessary to determine the employee who will be given the bonus. When choosing the best employee, the degree of efficiency of his work is taken into account, and not the number of goods sold.
Original data table:

To characterize efficiency, we will use three indicators at once: mean value, median and mode. Let's determine them for each employee using the formulas AVERAGE, MEDIAN and MODE, respectively:

To determine the degree of data scatter, we use a value that is the total value of the modulus of the difference between the mean value and mode, mean value and median, respectively. That is, the coefficient x=|av-med|+|av-mod|, where:
- av – average value;
- med – median;
- mod - fashion.
Let's calculate the value of the x coefficient for the first seller:
We will carry out calculations similarly for other sellers. Results:

Let's determine the seller to whom the bonus will be given:
Note: The SMALL function returns the first minimum value from the considered range of x coefficient values.

The coefficient x is some quantitative characteristics job stability for salespeople, which was introduced by the store economist. With its help, it was possible to determine the range with the smallest deviations in values. This method demonstrates how three methods for determining central tendency can be used at once to obtain the most reliable results.
Features of using the MEDIAN function in Excel
The function has the following syntax:
MEDIAN(number1; [number2];...)
Description of the arguments:
- number1 is a required argument characterizing the first numeric value contained in the range under study;
- [number2] – optional second (and subsequent arguments, up to 255 arguments in total), characterizing the second and subsequent values of the range under study.
Notes 1:
- When making calculations, it is more convenient to transfer the entire range of values being studied at once instead of sequentially entering arguments.
- The arguments accepted are numeric data, names containing numbers, reference type data, and arrays (for example, =MEDIAN((1,2,3,5,7,10))).
- When calculating the median, cells containing empty values or the logical TRUE, FALSE are taken into account, which will be interpreted as the numeric values 1 and 0, respectively. For example, the result of executing a function with logical values in the arguments (TRUE; FALSE) is equivalent to the result of executing it with arguments (1;0) and is equal to 0.5.
- If one or more function arguments take text values, which cannot be converted to numbers, or contain error codes, the function will result in the error code #VALUE!.
- Other Excel functions can be used to determine the sample median: PERCENTILE.ON, QUARTILE.ON, BIGGEST Examples uses:
- =PERCENTILE.IN(A1:A10,0.5), since by definition the median is the 50th percentile.
- =QUARTILE.ON(A1:A10;2), since the median is the 2nd quartile.
- =HIGH(A1:A9,COUNT(A1:A9)/2), but only if the number of numbers in the range is an odd number.
Notes 2:
- If in the range under study all numbers are distributed symmetrically around the mean, the arithmetic mean and median for this range will be equivalent.
- With large deviations of data in the range (“scatter” of values), the median better reflects the trend in the distribution of values than the arithmetic mean. An excellent example is the use of the median to determine the real level of salaries among the population of a state in which officials earn an order of magnitude more than ordinary citizens.
- The range of values under study may contain:
- An odd number of numbers. In this case, the median will be a single number dividing the range into two subsets of larger and smaller values, respectively;
- Even number of numbers. Then the median is calculated as the arithmetic mean of two numerical values dividing the set into the two subsets indicated above.